It’s very common to have to plot a number of individual lines on the same figure. In Matlab this can be as easy as plot(t, Data) which results in the following figure:
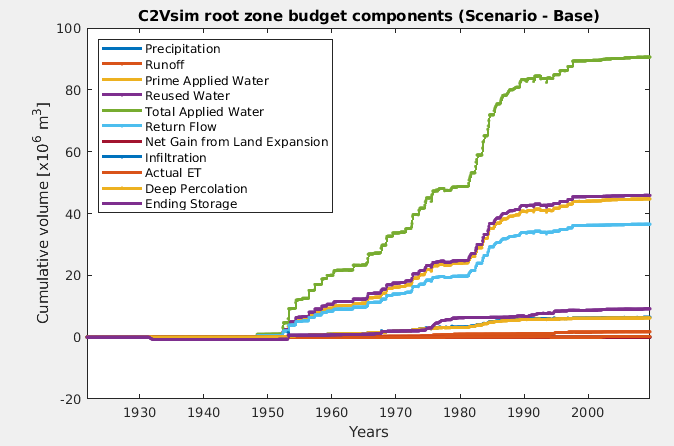
As you can see the default color order includes 7 colors which are repeated. You can get information about the default colors using get(gca,'Colororder') which returns a matrix 7×3 with the rgb channels of the above colors.
There are multiple ways to define a custom color order. One I have found and works well for me is the following. Instead of just plotting, get a handle for the plot
|
1 |
h = plot(t, Data); |
Then use the plot handle to change the color order
|
1 |
set(h, {'color'}, num2cell(colormat,2)); |
where colormat is a matrix Nx3 where N is the number of unique colors.
Of course, the selection of colors is important and not an easy task. The approach I suggest is the following which makes it quite trivial.
Navigate to http://colorbrewer2.org/. Choose the number of classes and the nature of your data. In my case I choose qualitative and 11 classes. Then from the dropdown menu choose RGB to display the RGB values of colors. Note that these are scaled between 0-255, while matlab requires scaling between 0-1.
A handy feature in this website is that you can copy/paste the values to an editor and convert it as matlab variable with a minimum effort. The result will look like the following:
|
1 2 3 4 5 6 7 8 9 10 11 12 13 |
colormat = [ ... 166,206,227; ... 31,120,180; ... 178,223,138; ... 51,160,44; ... 251,154,153; ... 227,26,28; ... 253,191,111; ... 255,127,0; ... 202,178,214; ... 106,61,154; ... 255,255,153... ]/255; |
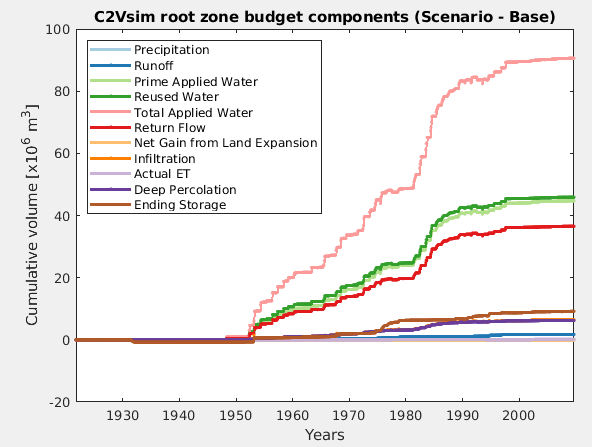
Using the above color order matrix will make the plot to use a different color for each line
The http://colorbrewer2.org/ has some limits on the number of colors that you can define for each category. If you think you need more colors then it’s better to question the type of plot you are trying to make.