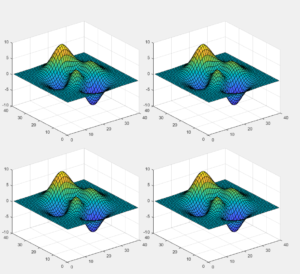
One very annoying thing in Matlab subplots is the large space around each subplot.
So the following is a way to overcome this.
To be fair, the credits for the solution goes to … (have a look at this link)
In short the following code, which has been copied from the link above, produces very nice and tight subplots
|
1 2 3 4 5 6 7 8 9 10 11 12 |
clf nRows = 2 ; nCols = 2 ; figure() ; set( gcf, 'Units', 'normalized', 'Position', [0.1, 0.1, 0.5, 0.8] ) ; [blx, bly] = meshgrid( 0.05:0.9/nCols:0.9, 0.05:0.9/nRows:0.9 ) ; hAxes = arrayfun( @(x,y) axes( 'Position', [x, y, 0.9*0.9/nCols, 0.9*0.9/nRows] ), blx, bly, 'UniformOutput', false ) ; for k = 1 : numel( hAxes ) axes( hAxes{k} ) ; surf(peaks(40)); set( gca, 'Visible', 'on' ) ; end |
