helix_axis
| main | Tutorials | Functions | website |
Generate points along a helix with axis defined by the points p1 p2. The density of the points is controled by the Nlay, Nppl, rd parameters Version : 1.0
Author : George Kourakos
email: giorgk@gmail.com
web : http://groundwater.ucdavis.edu/msim
Date 09-May_2013
Department of Land Air and Water
University of California Davis
Contents
Usage
[xp yp zp] = helix_axis(p1, p2, Nlay, Nppl, rd)
Input:
p1, p2 : coordinates of starting and ending points of the line that defines the axis
Nlay : defines the number of pitches or number of layers
Nppl : defines the number of points per pitch of layer
rd : is the radius
Output:
xp, yp, zp : coordinates of the points along the helix
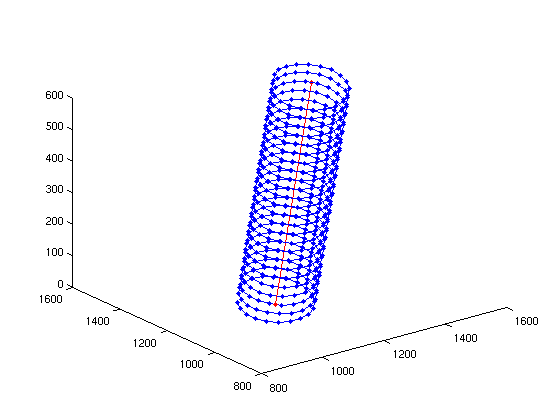
Example:
p1 = [1000, 1000, 100];
p2 = [1500, 1500, 500];
Nlay = 25;
Nppl = 20;
rd = 100;
[xp yp zp] = helix_axis(p1, p2, Nlay, Nppl, rd);
plot3(xp, yp, zp, '.-')
hold on
plot3([p1(1) p2(1)], [p1(2) p2(2)], [p1(3) p2(3)],'.-r')